Fundamental / Technical Analysis - Learn about Fibonacci Retracements in STRATEGIES & PLANS - Fibonacci retracements are a set of ratios, defined by the mathematically important Fibonacci sequence, that allow traders to identify key ...
Fibonacci retracements are a set of ratios, defined by the mathematically important Fibonacci sequence, that allow traders to identify key levels of support and resistance for stocks. Unlike moving averages, Fibonacci retracements are fixed, making them easy to interpret. When combined with additional momentum indicators, Fibonacci retracements can be used to identify potential entry and exit points to trade on trending stocks.
Fibonacci retracements are popular tools that traders can use to draw support lines, identify resistance levels, place stop-loss orders, and set target prices.
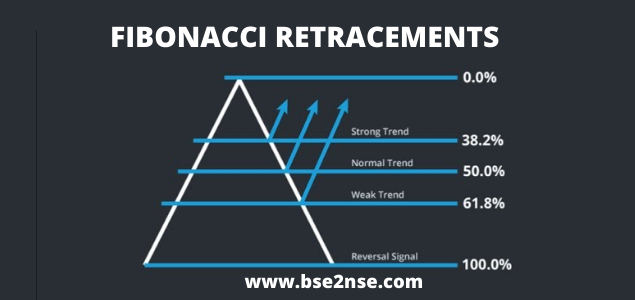
A Fibonacci retracement is created by taking two extreme points on a stock chart and dividing the vertical distance by the key Fibonacci ratios of 23.6%, 38.2%, 50%, 61.8%, and 100%.
Fibonacci retracements suffer from the same drawbacks as other universal trading tools, so they are best used in conjunction with other indicators.
How to use Fibonacci Retracement Levels?
Whenever there is a sharp move in the stock price either upward or downward, it usually has a high possibility of pullback before continuing in the direction of the main trend.
For example, suppose a stock moved from Rs 100 to Rs 200, then it may witness some pullback to 170 before moving to higher to say 250. Fibonacci analysis has its application in the Stock market and can be applied when you are expecting a correction after a sharp up move or a down move. It helps you identifying major halts or probable bounce back levels after a decline or advance as the case may be. These Fibonacci retracement levels create a good opportunity for the traders to make new positions in the direction of the trend.
The important Fibonacci ratios are 23.6%, 38.2%, 50% and 61.8% retracement which help traders to identify the probable extent of the retracement and position himself for the trade accordingly. Usually, 23.6% retracement is comparatively shallow and is suitable for flag breakouts or short-term pullbacks.
On the other hand, 61.8% retracement is comparatively deeper, which is considered as golden ratio and is very important level. However, retracements in the range of 38.2%-50% could be considered as a moderate correction. Usually, if the stock bounces from 38.2% retracement, the underlying strength of the previous move is considered strong. You can try out Fibonacci retracement calculator to have a good idea on the concept.
Though Fibonacci is one of the useful methods to analyse your chart but it doesnt provide an exact entry point rather an estimated area of entry.
Moreover, there is no guarantee that the price will reverse from any specified Fib level and hence you should combine it with other technical parameters as a confirmation. These levels are just an indication to track.


 Register To Reply