Fundamental / Technical Analysis - Support and Resistance in Technical Analysis in STRATEGIES & PLANS - The technical analysis uses various tools to predict the current and future price movements of the stocks of which support ...
-
07-17-2021 02:56 PM

Support and Resistance in Technical Analysis
The technical analysis uses various tools to predict the current and future price movements of the stocks of which support and resistance levels are the two fundamental elements. The investors and traders already having experience in the stock market must have heard of terms like, Nifty will find support at 15,600 and resistance will be at 16,000 levels. These are the day-to-day terminologies rolling down the streets of the stock market, but beginners find hard to make heads or tails out of such terms.
Concept of Support and Resistance
This is a concept in technical analysis that says that the price of a stock tends to stop and move in the opposite direction when it hits certain pre-determined price points.
Support level: This is a level at which the price of a stock does not fall down any further. The price is likely to bounce back and moves up in the opposite direction. This is a level where the demand from buyers is expected to be much higher than that of the supply from sellers.
Resistance level: A resistance level is the opposite of a support level. It is a price point (ceiling) at which the stock price is not expected to rise any higher. This is a price point at which there are more sellers than buyers in the market for the particular stock.
What is Support?
Understanding support and resistance levels on a candlestick chart can help you identify target price to either buy or sell. Support price is the price at which you can expect more buyers than sellers. Support level is the price on the chart, when traders can expect a maximum demand for a stock, in buying terms, coming its way. An important level market participant that you must look for in a falling market, the support resistance indicator more often than not acts as a trigger for buying. With the price of securities dropping, the demand for shares increases, and this forms the support line.
What is Resistance?
The resistance level on a candlestick chart is the price when you can expect more sellers than buyers. It prevents the price from rising further and resistance level indicates a price point on the chart when traders expect a maximum supply, in selling terms, for a particular stock. Always above the current market price, resistance often acts as an indicator to sell. Resistance level one of the key metrics which market participants have a keen eye on in a rising market. To put it simply, support and resistance are opposite to each other.
Breakout in levels
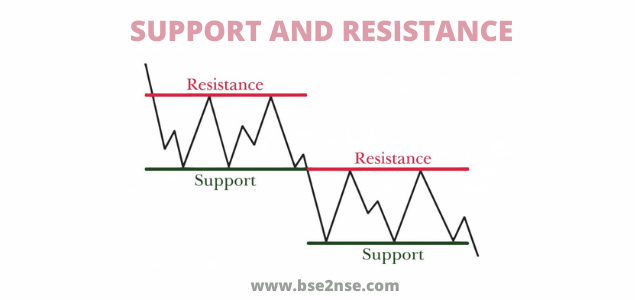
The support and resistance levels give the trader an idea about the price movement of a stock. However, it is entirely possible that the stock price breaks through these levels. And when this happens (as it often does), a new support and resistance level is created. That is, if the support level is breached, the price of the stock continues to fall until it reaches a new support level. And if the resistance level is breached, the price of the stock continues to rise until it reaches a new resistance level.
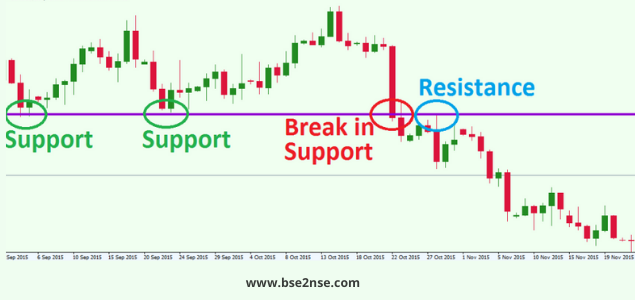
A support once broken, tend to act as a resistance after that. Similarly, when a resistance is taken out, it tends to act as support after that. There will be false breakdown/breakouts as well. Most traders take the help of volumes in such breakdown/breakout to understand the strength of the move.
Reliability of Support & Resistance
While support and resistance do act as indicators for buying and selling, you must not take them to be absolutely certain. To put it otherwise, they are only indicative in nature. There are several other factors that you need to consider before you decide to buy or sell a particular stock. These levels are most likely to be respected but there is no certainty that it will happen.
Use in Technical Analysis
For a trader in the stock market, determining the future price of a stock is perhaps the most important (and difficult) aspect of analysis. It is not possible to accurately find out the next price high (or low) on a consistent basis. As a result, the concept of support and resistance offers a fairly good understanding of price movements. Support and resistance levels help traders to identify trends and make trading decisions.
For example, if the trader sees that a particular stock has hit a support level, he may buy up shares of the stock. This is because the stock may rebound and rise higher. Similarly, as the stock approaches a resistance level, the trader may sell his shares and book profits.
Since the probability of predicted price action is high around these levels, one takes trade with a small stop loss rather than entering a position where there is no level to track.
Conclusion
Always exercise caution when the price of a stock hits these levels because there is always a lot of volatility around the support and resistance levels. Identification of key support and resistance levels is an essential ingredient to successful technical analysis. Even though it is sometimes difficult to establish exact support and resistance levels, being aware of their existence and location can greatly enhance analysis and forecasting abilities. If a support or resistance level is broken, it signals that the relationship between supply and demand has changed. A resistance breakout signals that the bulls (demand) have gained the upper hand and a support break signals that the bears (supply) have won the battle.

Visitors found this page by searching for:
https:bse2nse.comfundamental-technical-analysis10773-support-resistance-technical-analysis.html
,
Support and resistance breakout
Tags for this Thread


 Register To Reply