Fundamental / Technical Analysis - Technical Analysis Overview in STRATEGIES & PLANS - Technical analysis is the study of chart patterns and statistical figures to understand market trends and pick stocks accordingly. Sounds ...
-
07-17-2021 02:21 PM

Technical Analysis Overview
Technical analysis is the study of chart patterns and statistical figures to understand market trends and pick stocks accordingly. Sounds complicated? Here is a simpler definition.
One day the share price is up, another day it may be down. But over time, if you look at the stock prices movement, you may see trends and patterns emerge. The study of these chart patterns and trends in stock prices is called technical analysis of stocks. When you learn technical analysis of stocks, you will understand the big role those technical indicators play.
Use of Technical Analysis
It is a very effective tool to time the markets, i.e., determine the entry levels, the stop-losses, as well as the target levels. It takes into account everything that is likely to impact the prices, including fundamental reasons, stock specific news, results, events affecting same sectors stocks, political happenings and so on.
Technical analysts believe that historical price trends tend to repeat over time. So, they sit with historical stock charts, look at price and volume information and then using trends, they try to figure out how the stocks price may move in the future. Accordingly, they pick stocks that they feel will appreciate and sell the ones they feel will depreciate.
Key Factors influencing outcome of Technical Analysis
Technical analysis is applicable to securities where the price is only influenced by the forces of supply and demand. Technical analysis does not work well when other forces can influence the price of the security.
High Liquidity - Liquidity is essentially volume. Heavily-traded stocks allow investors to trade quickly and easily, without dramatically changing the price of the stock. Thinly-traded stocks are more difficult to trade, because there aren't many buyers or sellers at any given time, so buyers and sellers may have to change their desired price considerably in order to make a trade. In addition, low liquidity stocks are often very low priced, which means that their prices can be more easily manipulated by individual investors. These outside forces acting on thinly-traded stocks make them unsuitable for technical analysis.
No Artificial Price Changes - Splits, dividends, and distributions are the most common reasons for artificial price changes. Though there is no difference in the value of the investment, artificial price changes can dramatically affect the price chart and make technical analysis difficult to apply. This kind of price influence from outside sources can be easily addressed by adjusting the historical data prior to the price change.
No Extreme News - Technical analysis cannot predict extreme events, including business events such as a company's CEO dying unexpectedly, and political events such as a terrorist act. When the forces of extreme news are influencing the price, technicians have to wait patiently until the chart settles down and starts to reflect the new normal that results from such news.
It is important to determine whether or not a security meets these three requirements before applying technical analysis. That's not to say that analysis of any stock whose price is influenced by one of these outside forces is useless, but it will affect the accuracy of that analysis.
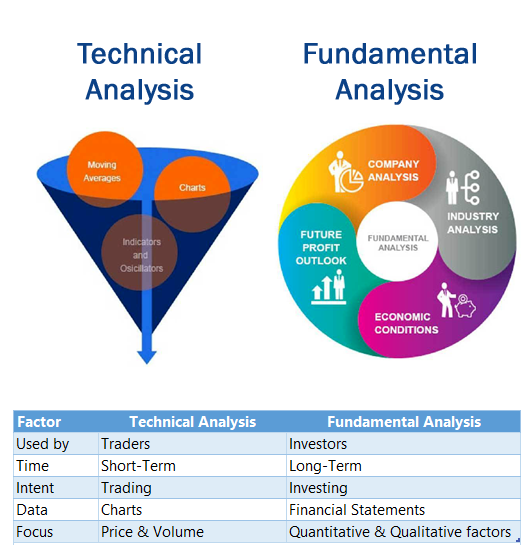
Technical Analysis Vs Fundamental Analysis
The technical-analysis approach to the study of stock charts is the opposite of the fundamental approach. If you were a fundamental analyst, you would study a companys financial statements, such as the income statement and the balance sheet, to ascertain its growth potential. You would also try to monitor factors outside these financial statements that would increase the companys earnings in the future. For example, you would keep track of the new businesses the company is investing in, the new markets it is entering, and the new technology it has adopted, and so on.
Technical analysis doesnt believe in this approach. It believes that stock prices move in circles. If you can spot the section of the circle the price is currently in, you will be able to make sound investment decisions. To identify the current stage of the price pattern, you would use some analytical tools. These include various types of stock charts, some momentum indicators and moving averages. We will get into these in detail in further sections.

-
07-17-2021 02:24 PM

Assumptions in the technical analysis of stocks
1. Market prices reflect all the information about a stock
Earlier, we said that fundamental analysis concerns itself with financial and other information about a stock. Technical analysis of stocks, though completely detached from fundamental analysis, works on a similar premise. If you are a technical analyst, you believe that all investors are aware of everything there is to know about a stock. They actually use this information when making buy/sell decisions. This information subsequently gets reflected in the stocks price and ultimately the stock chart. This is why they only study chart patterns to gauge market trends, and not concern themselves with fundamental factors.
2. Stock prices follow trends
Technical analysis of stocks is based on the idea that each stock chart has its own unique trend. Prices move only within this trend. Every move in the stock price will indicate the next move. Lets take the hypothetical example of a ripple. When you throw a stone in a pond, you know that consecutive ripples will get formed as soon as the stone hits the water. After a few ripples, the trend will die out. However, the next time you throw a stone, a similar ripple will appear again. Similarly, even for stock charts, you know the trend from past experiences. Naturally, the move in either direction may be larger or smaller than before, just like ripples. If you throw a larger or a smaller stone, ripples too will be larger or smaller respectively. However, the pattern of these ripples will not change dramatically.
3. Patterns tend to repeat themselves
The last assumption that validates a technical analysis is that trends are repetitive. In other words, suppose a stock chart moves in a hypothetical pattern- A-B-C. So, each time we reach C, we will again start from A, and then go to B and eventually C. This pattern will repeat itself without fail.
Only once you make this assumption can you predict future stock prices based on technical analysis. Without this assumption, there is no way to tell where the price will go next by simply looking at a chart.
Important technical indicators for Technical Analysis
Charts:
Price and volume charts are the most typical tools that are used as technical indicators for technical analysis. A volume chart depicts the number of shares of a company that were bought and sold in the market during a day. For the purpose of technical analysis, you may choose one of the traditional line or bar charts, or alternatively, use a candlestick chart. A candlestick chart is a special kind of chart that is particularly relevant for technical analysis. It is in the form of a series of consecutive candles. We will discuss candlestick charts in detail in the section on stock charts. Charts are used together with trendlines. Trendlines indicate the direction of movement of a stock over a period of time.
Moving Averages:
Moving averages are calculated to remove sharp, frequent fluctuations in a stock chart. Sometimes, stock prices can move very sharply in a small period of time. This makes it hard to discover a trend in the stock chart. To remove the impact of this, and make a trend more prominent, an average of a few days price is calculated. For example, if a five-day pattern of a stocks price is Rs.50, 53, 47, 45 and 52, it is difficult to tell the direction in which prices have actually moved. However, if you can calculate the average of these prices and compare them with the average of the next five days and the previous five days, you can ascertain a broad trend. This kind of moving average is called simple moving average (SMA). Other commonly used moving average concepts are exponential moving average (EMA) and linear weighted average (LWA). It may be noted though, that moving averages are calculated for longer durations. 9/20/50/100/200 days moving averages are more common.
Momentum Indicators:
Momentum indicators are statistical figures that are calculated based on price and volume data of stocks. These technical indicators act as supporting tools to charts and moving averages. Once you are through with forming an opinion about a stock based on the other tools we have discussed, you can use these indicators to confirm your views. Some momentum indicators are signs that occur before the price move you expected occurs. They confirm that the price is indeed going to move as you thought it would. These are called leading indicators. Other signs come after the stock has started moving in a particular direction. They are called lagging indicators. They confirm that the stock will continue moving in this direction. Indicators are also used together with moving averages.
Conclusion
There will always be an element of market behaviour that is unpredictable. There is no definitive guarantee that any form of analysis technical or fundamental will be 100% accurate. Although historical price patterns give us an insight into an assets likely price trajectory, that is no promise of success. Traders should use a range of indicators and analysis tools to get the highest level of assurance possible, and have a risk management strategy in place to protect against adverse movements.
Visitors found this page by searching for:
Tags for this Thread


 Register To Reply