Derivatives - MACO PC technique for intraday (high success rate & good risk:reward ratio) in MARKETS - mani sir how to upload image pls tell ...i saved two image of yesterdays trade in 5min and 15 min ...
-
07-19-2013 11:40 AM
mani sir how to upload image pls tell ...i saved two image of yesterdays trade in 5min and 15 min but dont know how to upload help me

-
07-19-2013 11:45 AM
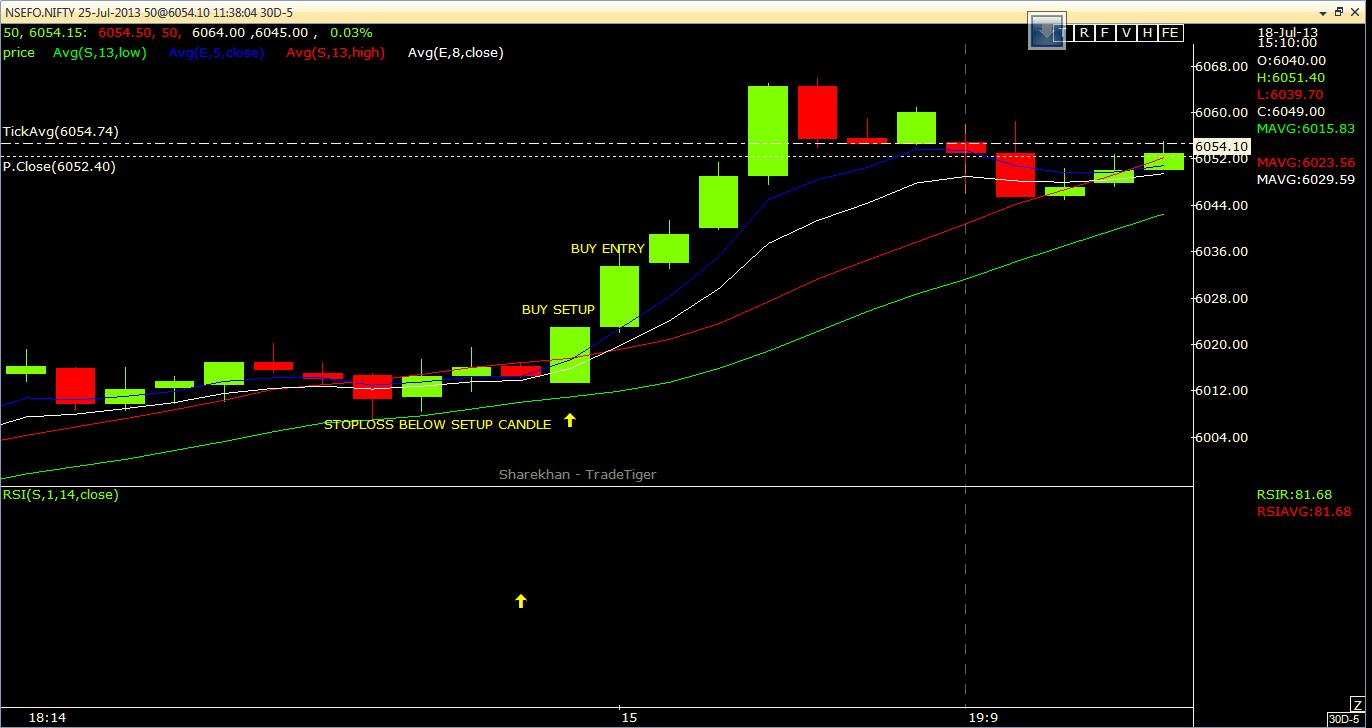
 sir i tried to attach this image ...hope i done it
-
07-19-2013 11:48 AM
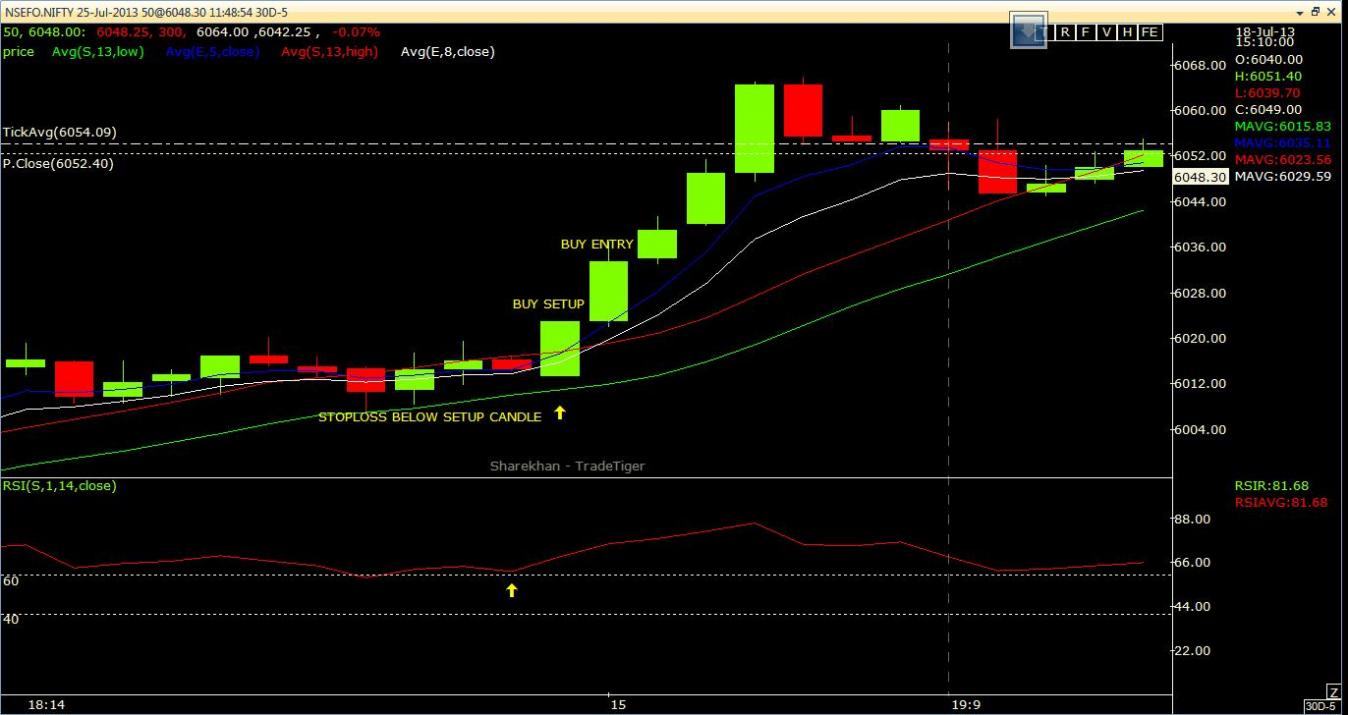
 another chart in 5min time frame ....
-
07-19-2013 11:51 AM
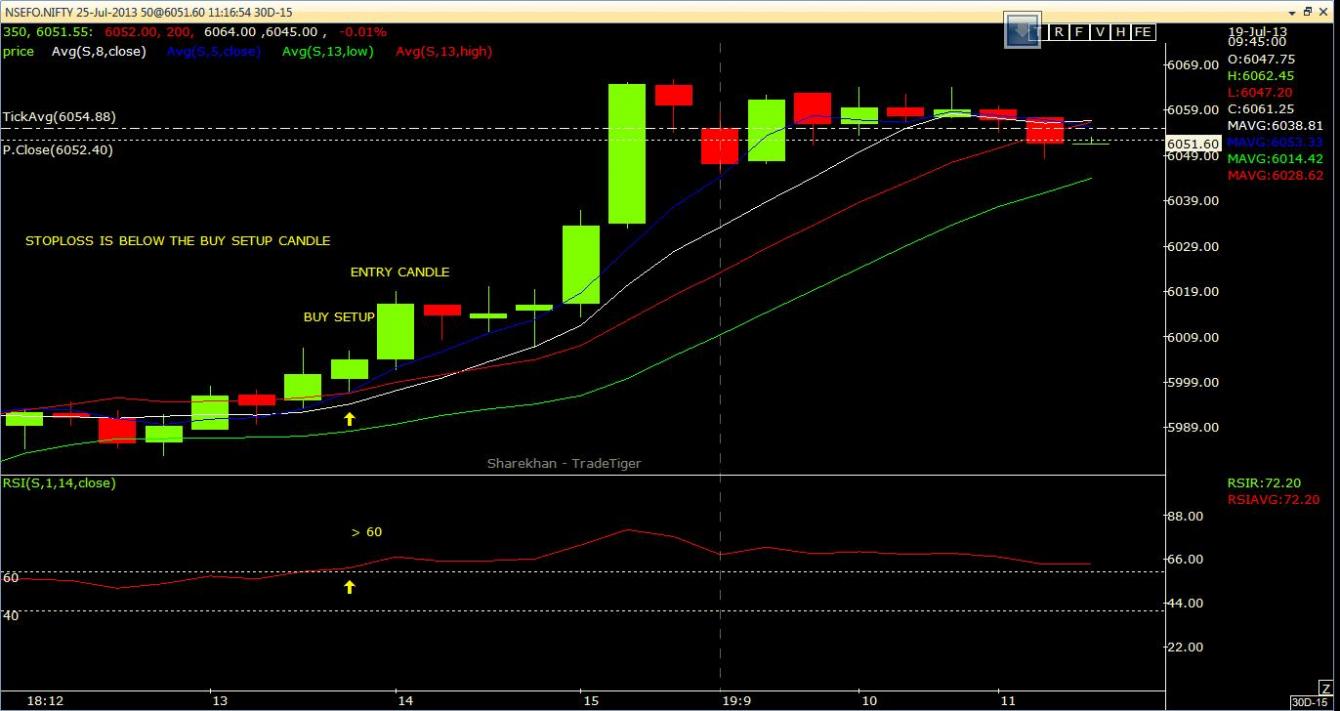
 some error in previous chart rsi not recorded ...see this
-
07-19-2013 11:54 AM
keep 2 points as filter for nifty for buy/sell entry after the buy/sell setup...hope u understand
-
07-19-2013 12:07 PM
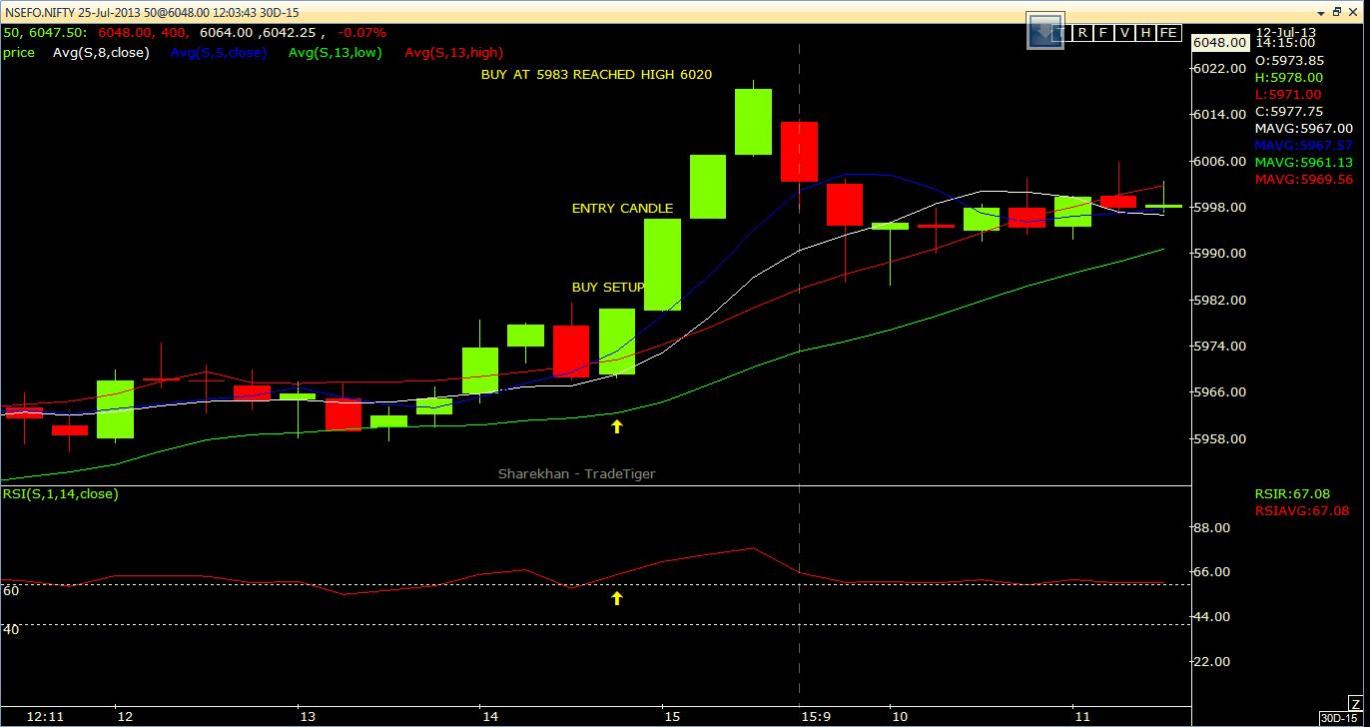 This technq works very well in all nse scripts i checked in all major scripts ...pls try with other script also and reply thanks
-
07-19-2013 02:35 PM
Below's an intra-day chart with 8 min and 13 minute EMA ...
i'll try to make a video making your strategy simple to understand ...

-
07-19-2013 04:37 PM
sir y did u posted this chart can u pls tell me..?
-
07-19-2013 04:43 PM
is there any confusion in my strategy pls reply me ill try to explain in simple way ..i request to those fellow traders who got many losses in intraday pls try this and one rupee technque with discipline u will earn decent profit i swear ..dont be greedy in market u cant catch top and bottom of market this my experience thank u
-
07-19-2013 04:44 PM

Originally Posted by
shakthi sir y did u posted this chart can u pls tell me..?
The chart that you posted are available only in Sharekhan ... The chart i post is live and anyone can use when they trade during the day ...
Its the intra-day Nifty chart ... with 8 minute EMA (Red) and 13 minute (Green) lines .... i think i can simplify your strategy to pick buy points and sell points ...
I understand your strategy ... i am just going to make it simpler so that even a totally new trader can follow it, with a chart which is available for everyone
Like i said, i will make a video, so that others can try it easily ... I will provide due thanks to you for sharing this strategy  I just tried it today and made 1000 profits intra-day ....
Accuracy should be 65% or more ... And we can exit with minimal losses with the simplification i am going to bring in .... Its hard to explain how i am going to fine tune your strategy ... You will understand once you watch my video ....
Visitors found this page by searching for:
Tags for this Thread


 Register To Reply