Chart Analysis - Chart set up for scalping/Trend reversals/Intraday in STRATEGIES & PLANS - In this thread Ill be explaining on what a trader can look at chart to determine potential trend reversals and ...
-
03-15-2020 10:47 AM

Chart set up for scalping/Trend reversals/Intraday
In this thread Ill be explaining on what a trader can look at chart to determine potential trend reversals and use this to scalp or take intraday trades.
Though there are many technical indicators available in trading platform, I like to keep the charts simple and use one set up for long term investment, swing trading and intraday trades. Using one set up, I prefer to look for repeating patterns and identify trades.
Following is my set up.
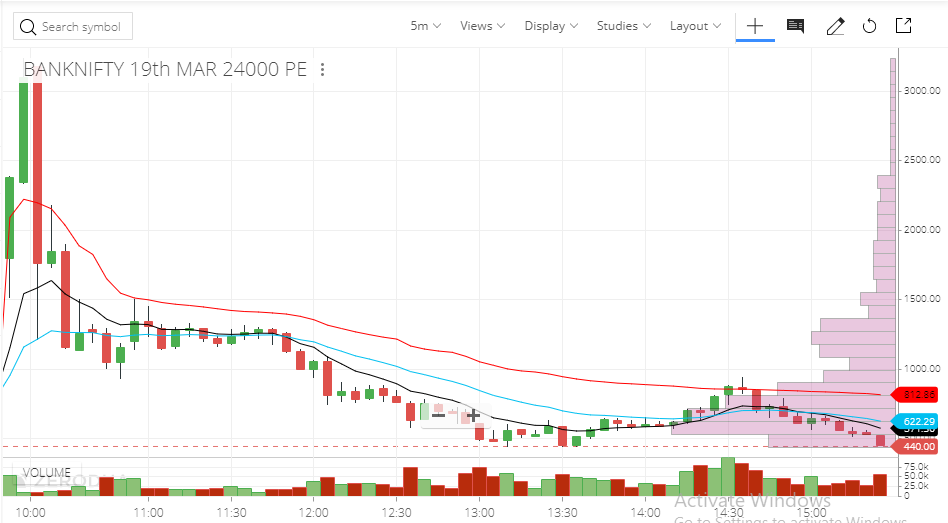
Red Line - VWAP Volume Weighted Average Price or ATP (Average Traded Price)
Black Line 9EMA 9 period exponential moving average (close prices are used)
Blue Line 20EMA 20 period exponential moving average (close prices are used)
Check the following chart Bank Nifty 24000 PE (19-Mar-2020 expiry)
This is a closer look of the same chart where it reversed.
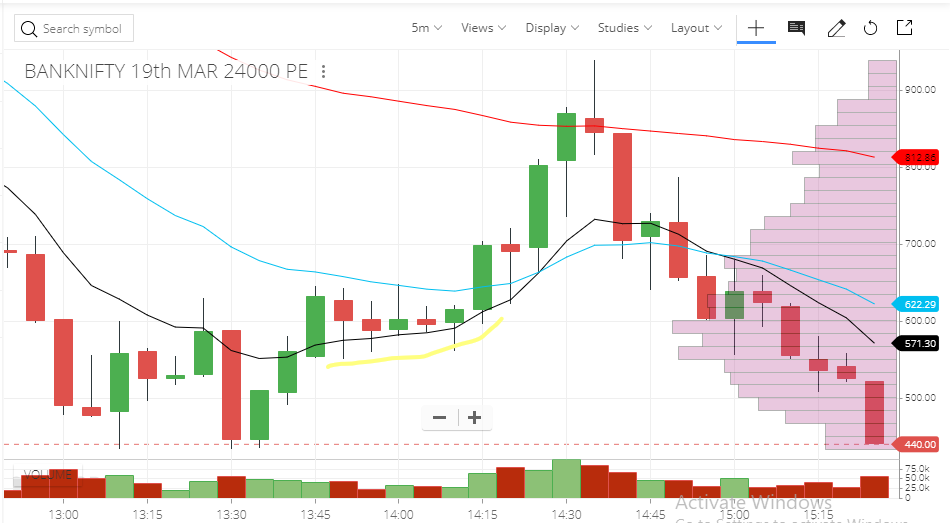
In an ongoing trend (in this case downtrend), when there is a candle closes crossing 9EMA, it signals potential reversal. There can be false signals as well. So for the confirmation, look at subsequent candles. When all candles take support at 9EMA (on closing basis), trend is likely to reverse. When candles close above 20EMA too, then it is confirmation. But dont enter at price far away from 9EMA. Most likely, there will be a retracement in subsequent candle to 9EMA and thats the ideal entry point. SL can be the below the candle that closed above 20EMA. First target should be VWAP or little below that. Most of the times, it will reverse at or near VWAP. Sometimes, it will go past VWAP as well, but it will halt around VWAP before any further up move.
In this chart, it reversed after hitting VWAP. Same logic can be applied on downtrend as well. When candle close below 20EMA, one can short near 9EMA when subsequent candle retraces. Those who are quick in trading, can scalp using this pattern.
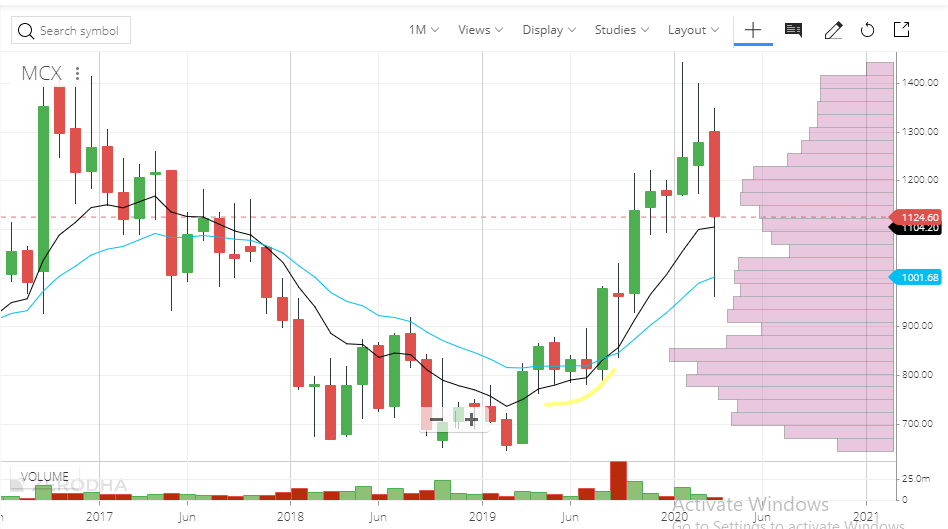
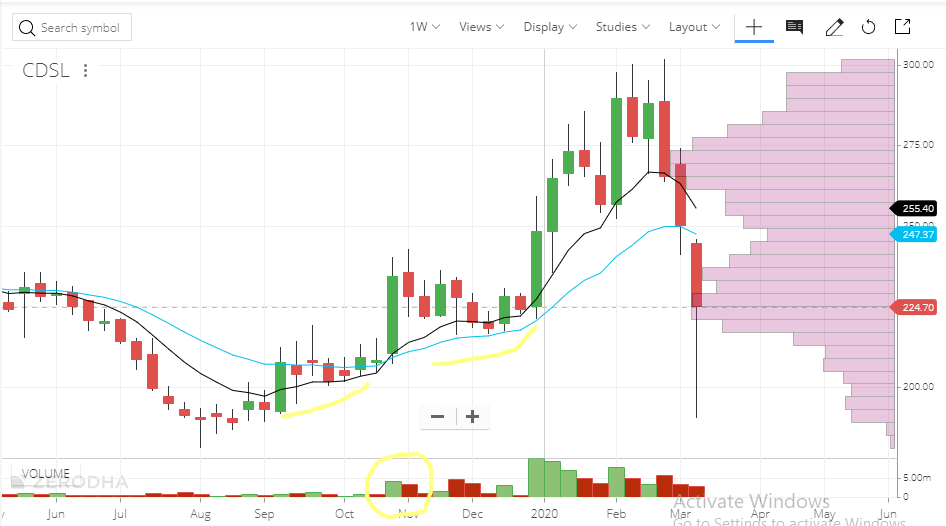
Swing Trading
The same set up can be used for swing trading too after reversing the downtrend.
Potential 20/30/40% returns based on prevailing market sentiment
Look at MCX monthly chart
Look at CDSL weekly chart

-
03-18-2020 05:01 PM
Similar Threads
-
-
-
Agriculture (ex : Coffee)
-
-
Visitors found this page by searching for:
bse2nse
,
option buying strategy Tags for this Thread


 Register To Reply