




Financial ratios are created with the use of numerical which are taken from financial statements to gain meaningful information about a company. It might not be possible for every investor to meet a company’s management or do an in-depth study of their financials. In such situations, financial ratios are key to understanding the health of the company at a quick glance. As it provides beneficial information about the company such as balance sheets, cash flow and income statements etc. Financial ratios are the perfect tool for investors to measure the health of a company.
Importance of Financial Ratios
It is essential for investors to understand key financial ratios, their meaning and impact on the stocks. Financial Ratios help:
• Investors in deciding whether to invest in a company or not.
• Investors track the company’s performance and can help early identification of trends.
• Investors compare the performance of the company against its competitors and industry as a whole.
Types of Financial Ratios
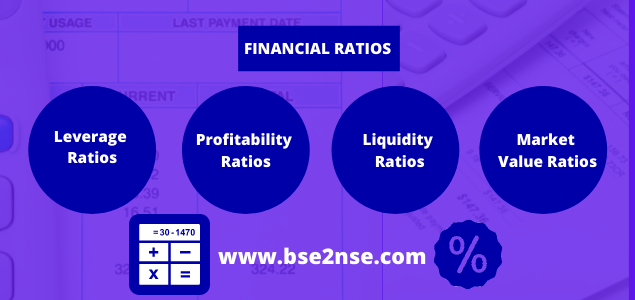
Financial Ratios are divided into various types based on the information that they provide. The key types of financial ratios are:
1. Profitability Ratios: Helps measure company’s ability to generate profits/income
2. Return Ratios: Helps measure company’s efficiency in managing the investments
3. Leverage Ratios: Helps measure company’s debt
4. Liquidity Ratios: Helps understand company’s ability to repay short-term and long-term loans.
5. Valuation Ratios: Helps evaluate the share price of a company.
Profitability Ratios
Profitability ratios define how profitable the operations of the company are on per rupee of sales basis.
EBITDA Margin: This ratio is useful in finding out the profitability of the company purely based upon its operations and direct costs.
A company with a higher EBITDA margin, indicates that it is able to operate with greater efficiency. EBITDA margins are useful in identifying profitability trends in an industry since it is not affected by the depreciation policies, funding decisions and taxation rates of the companies.EBITDA Margin = EBITDA / Net Sales
PAT Margin: Shareholders of a business get their dues only at the end, i.e. after paying all stakeholders, including the government. Hence, they would like to know how much of the business generated by the company actually comes their way. This is found by calculating PAT Margin.
A company with a higher ratio is seen as more efficient in managing costs and earning profits. A trend of increasing margins means improving profitability.PAT Margin = PAT/ Net Sales
Return Ratios
While Profitability ratios give a sense of profitability per rupee of sales by the business, they do not communicate anything on the productivity of each rupee invested in the business. This part of allocation of capital and its productivity is captured through comparing profits with the capital employed in the business.
Return on Equity (ROE): This is the single most important parameter for an investor to start digging for more information about a company. ROE communicates how a business allocates its capital and generates return. An efficient allocator of capital would have high ROE and a poor quality of business would have low ROE. ROE, sometimes also known as Return on Net-worth (RoNW).
Return on Capital Employed (ROCE): This ratio uses EBIT and calculates it as a percentage of the money employed in the firm by way of both equity and debt.ROE = PAT/Net-Worth
Net-Worth = Equity Capital + Reserves & Surplus
Higher the ratio, better the firm since it is generating higher returns for every rupee of capital employed. Investors can use this to analyse the returns of companies with different sizes in the same industry.ROCE = EBIT/ Capital Employed
Capital Employed = (Total Assets – Current Liabilities) or (Total Equity + Total Debt)
Leverage Ratios
Leverage ratios show how much capital comes from debt or assesses ability of the company to meet its long term financial obligations.
Debt to Equity Ratios: Debt to Equity ratio shows the total debt of a company against shareholder’s equity. A high debt to equity ratio is not a favourable sign for equity investors as it signifies high risk.
Interest Coverage Ratio: This financial ratio signifies a company’s ability to pay its interest obligations. High interest coverage ratio means that the company can make timely interest payments and is a good sign for debt investors.Debt to Equity Ratio = Total Liabilities / Shareholder’s Equity
Liquidity RatiosInterest Coverage Ratios = EBIT/Interest Expenses
Liquidity ratios such as current ratio, acid-test ratio etc helps investors understand if the company has enough assets to repay its short-term and long-term loans.
Current Ratio: Current ratio measures the company’s ability to repay short term loans with existing assets.
A high current ratio means that the company has sufficient cash to meet short term liabilities and is financially strong. Whereas, a low current ratio reflects poor financial health and may also indicate default.Current Ratio = Current Assets / Current Liabilities
Quick Ratio: Quick ratio is also known as Acid-test ratio and evaluates a company’s ability to repay its short term liabilities with its quick assets.
Operating Cash Ratio: This financial ratio highlights the number of times a company can pay off its liabilities from generated revenue.Quick Ratio/Acid-test Ratio = Current assets – Inventories / Current Liabilities
Cash Ratio: Cash ratio evaluates a company’s ability to repay its short-term liabilities with ONLY cash and cash equivalents.Operating cash Ratio = Operating cash flow / Current Liabilities
Cash Ratio = Cash & Cash Equivalents / Current Liabilities
 Register To Reply
