




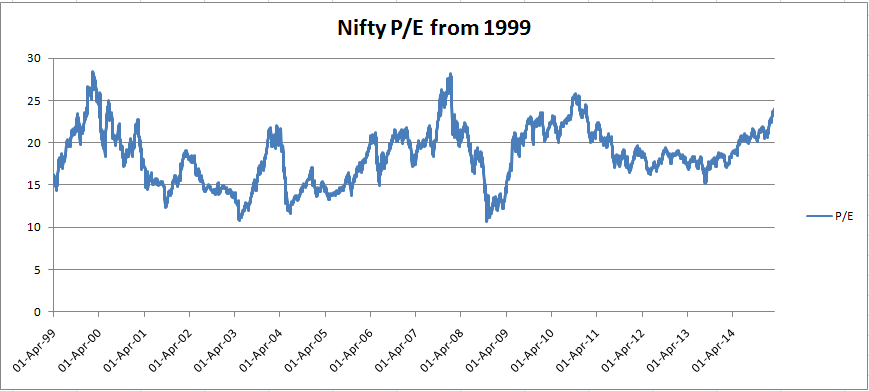
Belows the Nifty P/E chart for the last 10 years. (Extracted from NSE website https://nseindia.com/products/conten...rical_pepb.htm)Click Here to open a Trading Account with "Zerodha" through us and get FREE Training on Futures and Options Trading Strategies.
This is a very important chart for both technical and fundamental analysts. It gives an indication of when to Buy and When to Sell Nifty. Very useful for long term equity investors to time entry and exit in equity markets. P/E chart gives indication of when valuations are cheap and when valuations are peaking. This in-turn gives valuable insight on when to Buy and when to Sell.
You should not judge a stock by its P/E alone, but the Nifty index P/E alone is a pretty conclusive data. Checkout below for proof of that.
Lets analyse the above graph for more insight. All time low of Nifty P/E is 10.68 in 2008 during recession. Belows the Nifty P/E lows or support levels in the last 10 years. These are excellent levels to buy. Nifty P/E below 13 is a big BUY any-day.
Date Nifty P/E 1 27-Oct-08 10.68 2 12-May-03 10.84 3 1-Jan-99 11.62 4 24-Jun-04 11.82 5 13-Jan-09 12.16 6 21-Sep-01 12.3 7 29-Apr-05 13.27 8 25-Oct-02 13.83 9 14-Jun-06 14.92 10 18-Oct-00 17.18 11 5-Mar-07 17.2 12 25-May-10 20.06
All time high of Nifty P/E is 28.47 in 2000. Belows the Nifty P/E peaks or resistance levels in the last 10 years. These are best levels to SELL. Nifty P/E above 24 is a big SELL any-day.
Date Nifty P/E 1 11-Feb-00 28.47 2 8-Jan-08 28.29 3 12-Dec-07 27.69 4 13-Oct-10 25.91 5 23-Dec-99 24.22 6 31-Dec-09 23.17 7 9-Feb-01 22.78 8 8-Mar-04 22.01 9 16-Oct-06 21.65 10 31-Dec-03 20.73 11 26-Feb-02 19.14 12 19-Dec-05 17.2
Now that we understand the P/E chart, here's Nifty Chart since 1998.
Discuss your views. Make your own calls what is the best time to buy and sell !
 Register To Reply
