Intra-Day - Strategy to trade in F&O top gainers and losers - Intraday in Equity / Stocks - Hello Trades, in this thread, Ill be sharing a strategy to pick stocks for intraday trading. I prefer to do ...
-
04-12-2019 06:37 PM

Strategy for intraday trading
Hello Trades, in this thread, Ill be sharing a strategy to pick stocks for intraday trading. I prefer to do this in cash segment, but one can apply this in futures as well. But those who want to do this in futures, first attempt in cash market and see how this works before using in futures as the risks involved in futures trading is high when compared to cash segment. Even in cash segment, one gets leverage anywhere between 10 to 15 times the capital and is already heavily leveraged.
Traders: This is suited only for those who can be at system during market hours. For those in office or doing business who can check the market only few times in a day, kindly avoid this.
Theory: This is to be applied to stocks on which derivatives segment is enabled as they will have good liquidity. A stock being a top gainer among F&O stocks for most part of the day, will finish as top gainer. Same applied to top losers.
Identification of stocks: Dont rush into any trade. Wait till 12PM or 1PM to see the trend of the day. But keep track of top 3 gainers and top 3 losers among F&O stocks. It can be found in NSE website at this link https://www.nseindia.com/live_market...ers_losers.htm
By default Nifty 50 stocks will be selected. You can click on F&O Securities as in following image.
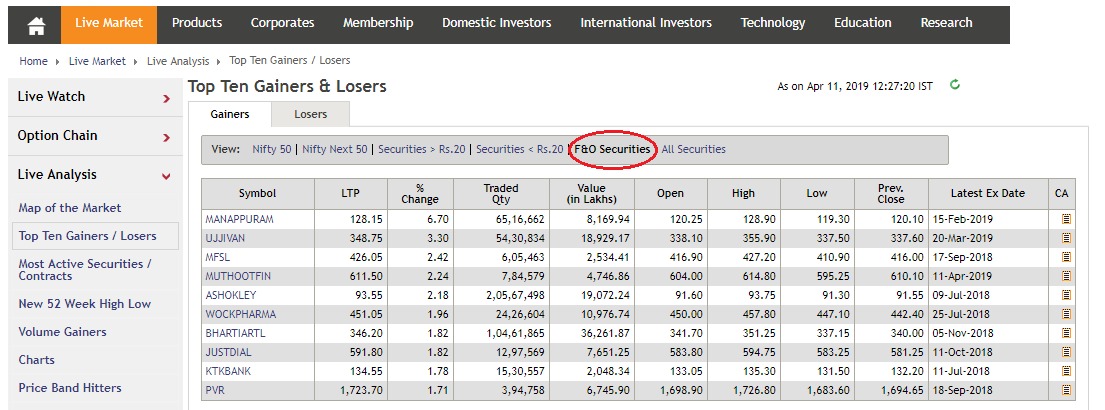
You can select Losers and then click on F&O Securities to see top losers at that point in time.
Top 3 stocks will keep changing as trading progress, so one has to keep track of this to see the stock that is in top 3 for most part of time till the point a trade is initiated.
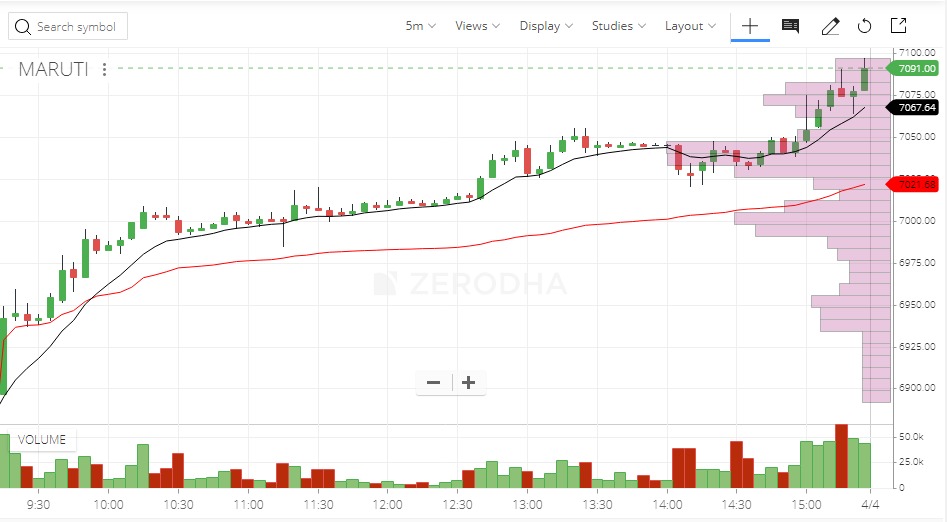
Chart structure: Open 5 minutes candlestick chart of all 3 top gainers and all 3 top losers. Observe the chart pattern. Include VWAP (Volume Weighted Average Price) and 9EMA lines in the chart. If a stock is moving up or down in one direction, then you should be able to observe a triangle getting formed (Let's name it as "trend triangle") and the distance between VWAP and 9EMA line will keep increasing as the day progress. There should be only one cross over of VWAP and 9EMA. One can change chart to 15 minutes just to confirm the trend as this will give a different perspective of trend.
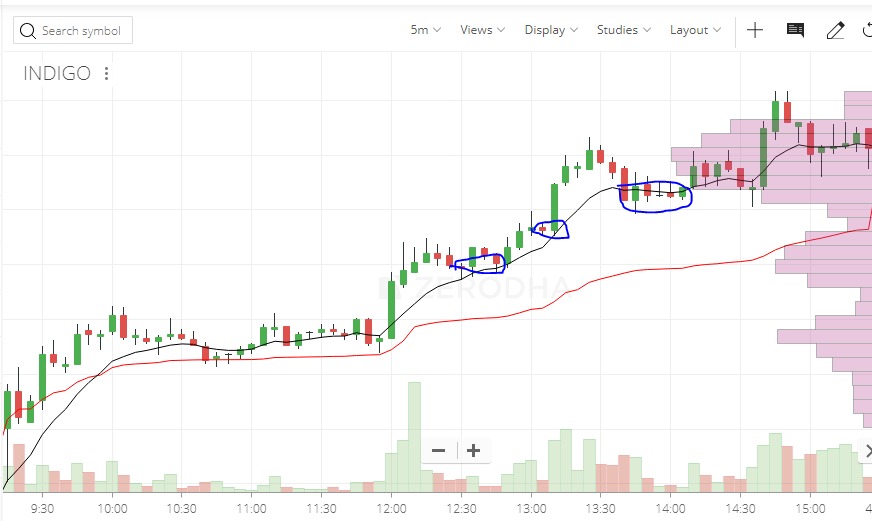
For bullish stock, 9EMA should be always above VWAP or there should be only one crossover of 9EMA from bottom to top on VWAP. Such a chart structure is perfect for going long. (Refer to following image).
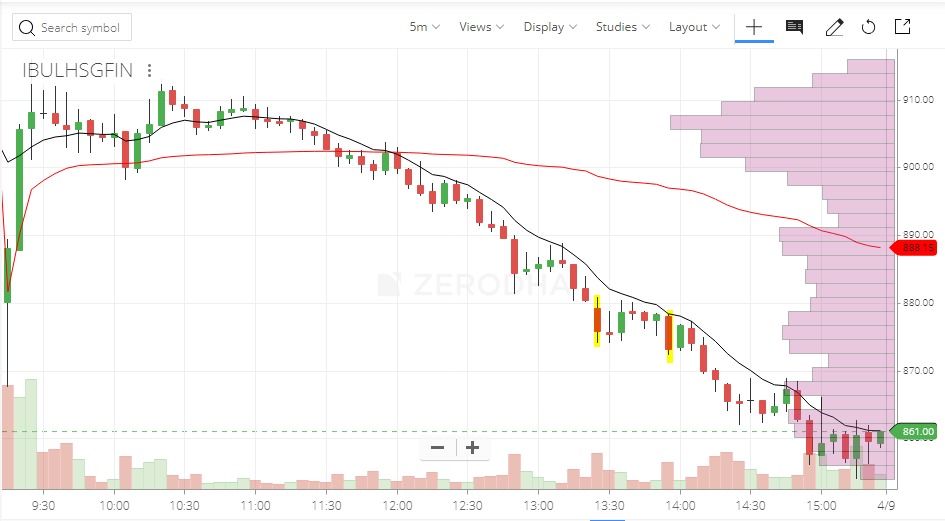
For bearish stock, 9EMA should always be below VWAP or there should be only one crossover of 9EMA from top to bottom on VWAP. Such a chart structure is perfect for going short. (Refer to following image).
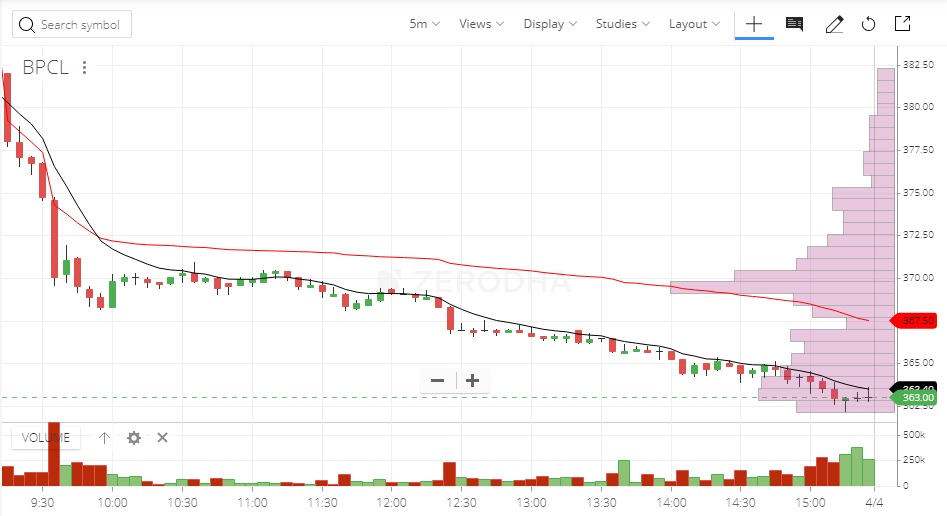
Above two chart are examples of perfect setup. This will happen when they remain among top 3 gainer or top 3 loser throughout the day and not much volatility in market.
During any market volatility, a top bullish stock corrects and finds supports at VWAP and rebounds, even this is an entry point. (Refer to the image below). Though it may not be an ideal trade, but still one can give a try.
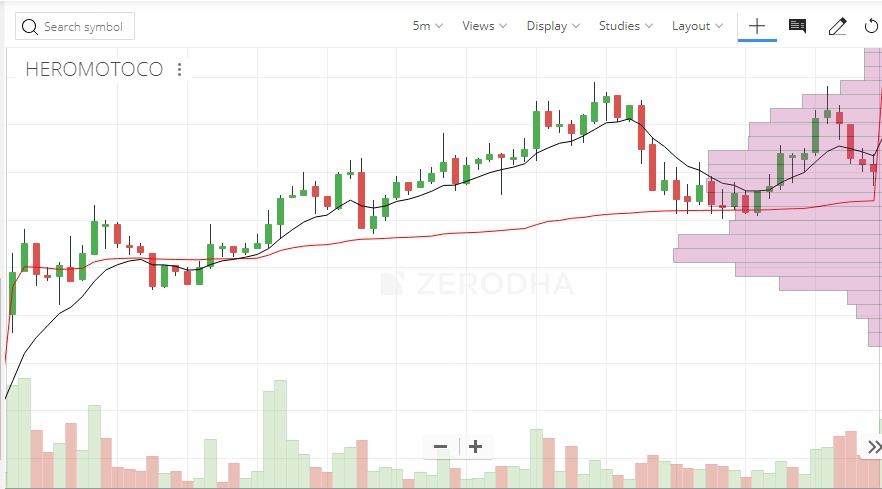
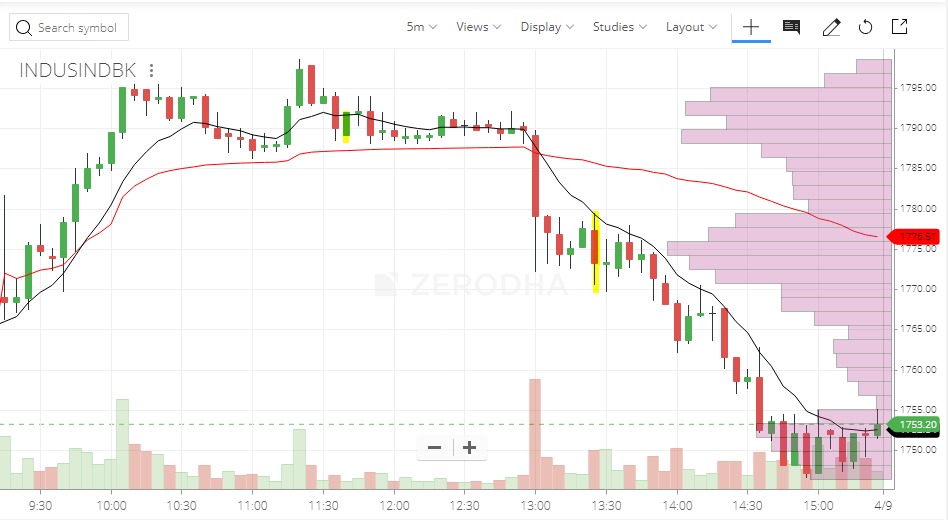
At times, fully bearish and bullish stock will never come to VWAP at all. So one can see if it comes to 9EMA to enter the trade (refer to following image where it is highlighted). Entering near VWAP is good as the risk reward will be more favourable. Entering near 9EMA is not as good as entering near VWAP but still better than entering when price is far away from 9EMA.
(Note: 9EMA is chosen after trying different numbers as I find this is doing better. There is no other reason for using 9EMA).
At times, you might not have a clean chart in a stock initially, but as the trading day progress, a clear trend will set in. One can initiate trade in such stocks as well as long as they remain in top 3 loser or gainer after the change in trend. (Refer to the following image).
There are scenarios where this has failed as well. This stock was a top gainer for more sometime but trend changed completely as hit SL.
Caution: While trading on Thursdays, one should be cautious about the fact that it is an expiry day for Nifty and Bank Nifty and stocks in these index will have more volatility. So exercise caution while trading on Thursdays, mostly post noon.
Target & Stop loss: Mostly, brokers will give leverage from 10 to 15 times on F&O enabled stocks to trade in intraday in cash segment. Even if one is able to catch 1% move, then that is equivalent to 10% returns on capital assuming you use maximum leverage covering the transaction costs as well. One can apply same as stop loss. So the risk to reward is 1:1. As long as stocks are selected correctly, there are more chances of hitting the target. If one can make profits consistently, then can increase the target upwards.
Price Levels to watch for: Stocks tend to take a breather when it comes near a round value like 5% or 10% of its stock price. Example: If a stock price is around 1000, then if the price comes to 1100 or 900 (10% of price is 100) OR if the price comes to 1050 or 950 (5% of the price is 50), stock movement either up move or down move will be halted for a while. Trend has to be strong enough to take it past these levels as there will lot of supply and demand at these price levels. This could be one reason for the break in momentum in trend around these price levels. Or it could be even due to option trades who have taken position at strikes near these levels. If they sense the trend is strong enough for the level to cross, they need time to unwind their open interest. This could a reason as well. So dont initiate a trade when price is yet to cross such price levels. Wait for the price to cross and then take trade.
Order Type: Some prefer to use Bracket Order as trade need not be monitored throughout and if stock moves in expected direction, target will be booked by the system. During initial days, one can use this. But on a trending day or once comfortable with this style of trading, one can look to use Cover Order to capture most of the movement. This will come in handy when trend doesnt reverse, which is the case mostly on top 3 gainers and losers. Alternatively, one can use bracket order with 2% to 3% target and 1% stop loss. Because at times there will be spike and then price will settle down. BO target can be hit in spike at times. It is up to traders to decide what order type to use.
Checklist: If you are someone who cant wait or control the urge to trade and if this is resulting in poor stock selection, one can use the following as check list.

Capital Allocation: I personally wanted to split the capital into 3 equal parts and deploy 2 retaining one for any other opportunity or to use if market turns trend.
Overall trend of market: One will get fair idea by looking at % change of top 10 gainer and losers. If top 10 gainers are like 2% and above, top 10 losers are like less than 2%, then trend is up. One will learn this as you observe more in market.
If one is doing intraday, then a stock is expected to trend in a direction, which is 50:50 probability. Nothing is for sure in markets. By selecting such stocks to trade, one is just changing the probability to something like 70:30 or 80:20, just increasing the odds of being correct. If there is sudden change in trend in market or just in that stock and hits stop loss, one has to accept it and learn how it could have been avoided. Not all SL can be avoided, like market falling big in few minutes as there wont be time to react. But some SL hit can be corrected in case if the stock selection is wrong (selecting a stock outside of top 3 gainers & losers with a hope that it will enter into top 3. It may work at times, but mostly it will fail. Dont do hope trades.)
I personally prefer to sell options on Nifty (positional short strangles initiating at 45DTE and exiting at 15DTE). But I was looking for ways to pick stocks for intraday as more retail traders wont have enough capital to write options. Also SEBI/NSE keep on increasing the margins required to keep away retail from derivative segments or to make retail take more risk. Thats something we cant control. So the above intraday strategy, as far as I have tracked, seems to be working fine. One can try this in small quantities in cash segment and when consistent enough in trades, can increase the quantity.
Any queries on this way of picking stock, please reply to this thread.

-
04-07-2020 10:05 PM
Visitors found this page by searching for:
bse2nse
,
Can we do intraday trading in top gainers,
https:bse2nse.comintra-day10523-strategy-trade-f-o-top-gainers-losers-intraday.html,
can we do intraday in top gainers,
nse top gainers strategy,
when is the time to spot top gainers or top losers,
using top gainers Tags for this Thread


 Register To Reply